

Updated April 7, 20201
Who else gets anxious when they get their A1c results?
I still do! Even after 27 years of blood draws and appointments, I still get a little anxious when I get that email saying my lab results are ready, and I still judge myself based on this number.
Diabetes treatment (and diagnosis) has been based primarily on the Hemoglobin A1c (HbA1c) since the 1960s. Both patients and providers often get hung up on this percentage, but what does it mean?
Does it mean the same for everyone?
Should we even be focusing our care so heavily on a single lab result?
Note: This is an update to a previous post on HbA1c that highlights some of the drawbacks and factors that may impact the HbA1c test that many may not be aware of.
What is HbA1c?
HbA1C is a measure of glycated hemoglobin (glucose bound to the hemoglobin protein in your red blood cells). A1c is a minor hemoglobin component formed by the condensation reaction where glucose attaches to the N-terminal valine residue of each β-chain of hemoglobin A (a post-translational modification of HbA) in erythrocytes (red blood cells). This occurs over the life span of the erythrocytes, which averages 120 days.(1)
Formation of A1c is proportional to the average concentration of glucose within the red blood cell during its lifespan, which is why it is used as a marker of average blood glucose levels are over a period of approximately 3 months. Hemoglobin A1C is a weighted mean, meaning that the most recent 6-week period may have a greater influence on A1c results compared to levels from the previous 6 weeks. (4)
HbA1c in Practice
In practice, HbA1c is used both in diagnosis and management of diabetes. It is frequently used to guide treatment decisions, and when other metrics are unavailable, provides an estimate of average blood sugars over the past three months.
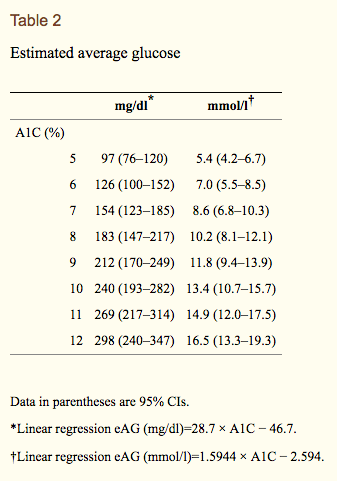
The established relationship between A1c values and estimated average glucose can be described by the formula 28.7 x A1c – 46.7 = eAG , and the following table from the American Diabetes Association (ADA).

But this chart can be a bit misleading…
The chart above can sometimes be misleading. In clinic we frequently see a high amount of variation, and find that A1c doesn’t always correspond with the trends patients may see on continuous glucose monitors or blood sugar logs. An average blood glucose of 126 doesn’t necessarily correspond to an HbA1c of 6%, and clinicians often see blood sugar values higher or lower than the A1c result would suggest.
Look closely at the 2008 study, which established these estimated average glucose levels by comparing CGM data to A1c, and focus on the 95% confidence intervals. Although the estimated average glucose levels for participants with an A1c of 7% was 154 mg/dl (using a linear regression model), the 95% confidence Interval was 123 – 185 mg/dl. So, approximately 95 out of 100 patients with an A1c of 7.0 could have an average glucose anywhere from 123 mg/dl to 185 mg/dl , a pretty wide range considering that 185 is considered high and 123 is considered a pretty good target. Furthermore, an A1c of 8% could reflect an average blood glucose anywhere from 147 mg/dl to 217 mg/dl. (2) This means that someone could have an A1c of 8.0% and have generally lower blood sugars and a lower average blood sugar than someone with an A1c of 7.0%!
These differences across individuals may be due to differences in how red blood cells bind glucose, variable glycation or deglycation rates or even reflect differences depending on the assay used, so we sometimes see differences depending on the lab where it was analyzed.(7) See next section for more on these potential differences.
Furthermore, looking closer at the study sample, you see that most participants in these studies were white (approximately 75%) and average age was 42, which may limit the generalizability of these results to populations that were not well represented in the study sample. This is a limitation in a lot of the research on type 1 diabetes, and historically study samples have been primarily white middle aged males.
Estimates may not Apply to All
Another issue with taking A1c to represent the above estimated glucose levels is that these results may not translate to all age groups and races/ethnicities. In fact, in a number of studies, A1c hasn’t correlated well with estimated average blood glucose from CGM data.
The DirecNet study, which examined A1c and blood glucose levels in children age 4 to 17 with type 1 diabetes, found significant variability in average glucose when compared with A1c level, suggesting that using estimated average glucose values from A1c could be problematic in the pediatric population.(5)
There is also quite a bit of research suggesting there may be differences across racial/ethnic groups.(10) A study published in Annals of Internal Medicine in 2017 found that for a given HbA1c level, mean glucose was significantly lower in people who identified as black than in people who identified as white. This suggests that HbA1c levels may correspond to a different mean glucose concentration, and that there may be differences in glycation rates of hemoglobin.(9) This raises the question of whether some of the practices utilizing only A1c are inherently biased, and suggests the need to reexamine A1c targets and treatment decisions with more diverse study populations.
Factors that may impact HbA1c Results
Finally, given that HbA1c is based on red blood cell turnover, there are multiple factors that may falsely impact HbA1c results by influencing red blood cell turnover. These are listed below:
False increase:
- Anemias associated with decreased red blood cell turnover (iron deficiency anemia, vitamin B-12, folate deficiency anemias)
- Asplenia
- Uremia
- Severe hypertriglyceridemia
- Severe Hyperbilirubinemia
- Chronic alcohol consumption
- Chronic salicylate ingestion
- Chronic opioid ingestion
- Lead poisoning
False Decrease:
- Anemia from acute or chronic blood loss
- chronic renal failure
- Sickle cell trait (6)
- Splenomegaly
- pregnancy
- Vitamin E ingestion
- Ribavitin and interferon alpha
- Vitamin C ingestion (when A1c is measured by chromatography) due to competitive inhibition of glycosylation
It Misses Variability
Another important factor to mention is that A1c doesn’t take any variability into account. A person could be having severe low blood glucose events and extremely high blood glucose and have the same A1c as another person who had was relatively stable and in the normal range 90% of the time. Hypoglycemia can be extremely dangerous, but looking solely at A1c doesn’t provide any information on whether a patient is experiencing a lot of low blood sugars.
Looking beyond HbA1c
Consider the bigger picture!
Diabetes care is evolving, and we now have the technology to better track and manage blood sugars. Although there is substantial research to support the A1c goals laid out by the American Diabetes Association and the American Association of Clinical Endocrinologists (<7 % and <6.5% respectively), I believe it is important to understand the limitations of treating diabetes based solely on the A1c test. While continuous glucose monitoring is not an affordable option for all, the hope is that it will become standard of care in the future, making it more accessible to all. While HbA1c can be an efficient and useful metric for tracking patients with both type 1 and type 2 diabetes, by making treatment decisions based on HbA1c values alone, we may be missing those crucial details, patterns, and trends which can greatly impact both our health and our quality of life. It’s time to look beyond HbA1c, and use other metrics like time in range (TIR), standard deviation, coefficient of variation, and other metrics in conjunction with HbA1c. HbA1c is just a one piece of the larger puzzle of diabetes management.
For more information check out:
- Radin MS. Pitfalls in Hemoglobin A1c Measurement: When Results may be Misleading. Journal of General Internal Medicine. 2014;29(2):388-394. doi:10.1007/s11606-013-2595-x.
- Translating the hemoglobin A1c assay into estimated average glucose values(link is external)
David M. Nathan, Judith Kuenen, Rikke Borg, Hui Zheng, David Schoenfeld, and Robert J. Heine, for the A1c-Derived Average Glucose (ADAG) Study Group. Diabetes Care 2008 - Bunn HF, Haney DN, Kamin S, Gabbay KH, Gallop PM. The biosynthesis of hemoglobin A1c: slow glycosylation of hemoglobin in vitro. J Clin Invest. 1976;57:1652–1659. doi: 10.1172/JCI108436.
- Tahara Y, Shima K. Kinetics of HbA1c, glycated albumin, and fructosamine and analysis of their weight functions against preceding plasma glucose level. Diabetes Care. 1995;18:440–447. doi: 10.2337/diacare.18.4.440.
- The Diabetes Research in Children Network (DirecNet) Study Group. The relationship of A1c to glucose concentrations in children with type 1 diabetes: Assessments by high frequency glucose determinations by sensors. Diabetes care. 2008;31(3):381-385. doi:10.2337/dc07-1835.
- Lacy ME, Wellenius GA, Sumner AE, et al. Association of Sickle Cell Trait With Hemoglobin A1c in African Americans. JAMA. 2017;317(5):507–515. doi:10.1001/jama.2016.21035
- Welsh KJ, Kirkman MS, Sacks DB. Role of Glycated Proteins in the Diagnosis and Management of Diabetes: Research Gaps and Future Directions. Diabetes Care. 2016;39(8):1299-1306. doi:10.2337/dc15-2727.
- Wright LA-C, Hirsch IB. Metrics Beyond Hemoglobin A1C in Diabetes Management: Time in Range, Hypoglycemia, and Other Parameters. Diabetes Technology & Therapeutics. 2017;19(Suppl 2):S-16-S-26. doi:10.1089/dia.2017.0029.
- Bergenstal RM, Gal RL, Connor CG, et al, for the T1D Exchange Racial Differences Study Group. Racial Differences in the Relationship of Glucose Concentrations and Hemoglobin A1c Levels. Ann Intern Med. 2017;167:95–102. [Epub ahead of print 13 June 2017]. doi: https://doi.org/10.7326/M16-2596
