
Who gets anxious when they get their A1c results?
I sure do! Even after 25 years of A1c checks and endocrinology appointments, I still seem to get nervous when I get that email saying that my lab results are ready, and my blood pressure always seems slightly higher at my endocrinologist’s office than any other appointment.
Since the late 1960s, diabetes treatment has been based on a single number, the Hemoglobin A1c (HbA1c). A diabetic’s adherence and control (two words I’m not a huge fan of) are often judged by the results of this lab. Both patients and providers get so hung up on this percentage, but what does it even mean, and should we even be focusing our care so heavily on a single lab result?
What is HbA1c?
HbA1C measures glycated hemoglobin (glucose bound to the hemoglobin protein in your red blood cells). More specifically, A1c is a minor hemoglobin component formed by the condensation reaction where glucose attaches to the N-terminal valine residue of each β-chain of hemoglobin A (a post-translational modification of HbA) in erythrocytes (red blood cells). This occurs over the life span of the erythrocytes, which averages 120 days.(1) The formation of A1c is directly proportional to the average concentration of glucose within the erythrocyte during its lifespan, which is why it is used as a marker of what average BG levels are over a period of approximately 3 months. Hemoglobin A1C is a weighted mean, meaning that the most recent 6 week period will have a greater influence on A1c results compared to levels from the prior 6 weeks. (4) It is important to note that as a weighted mean, it does not take into account fluctuations in blood glucose.
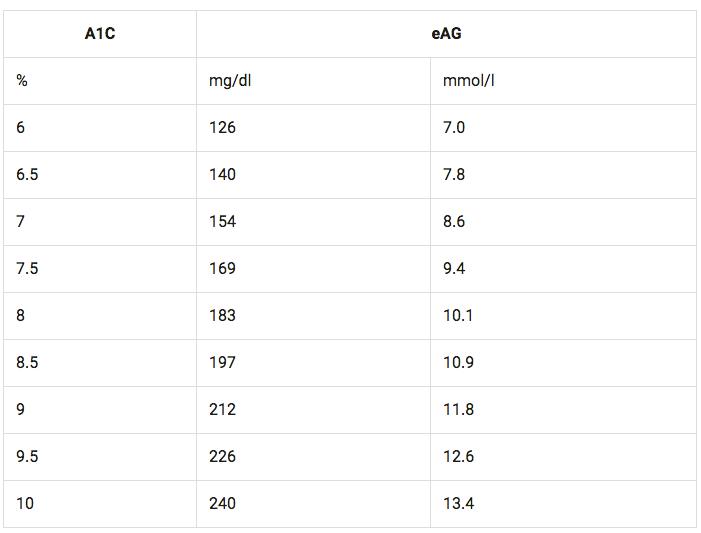
The relationship between A1c values and estimated average glucose can be described by the formula 28.7 x A1c – 46.7 = eAG , and the following table from the American Diabetes Association (ADA).
But, In actuality A1c is not that Simple
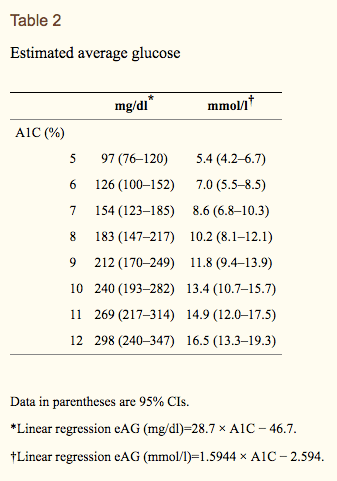
The chart above can be misleading. In clinic we often see variation, and find that A1c appears to differ between patients. Clinicians often see blood sugar values higher or lower than the A1c result would suggest. Looking closely at the 2008 study, which established these estimated average glucose levels by comparing CGM data , you get a bit of a broader picture by examining the 95% confidence intervals. Although the estimated average glucose levels for participants with an A1c of 7% was 154 mg/dl (using a linear regression model), the 95% confidence Interval was 123 – 185 mg/dl. This basically means that 95 out of 100 patients with an A1c of 7.0 could have an average glucose anywhere from 123 mg/dl to 185 mg/dl , a pretty wide range considering that 185 is considered high and 123 is considered a pretty good target. Furthermore, an A1c of 8% could reflect an average blood glucose anywhere from 147 mg/dl to 217 mg/dl. (2) This means that someone could have an A1c of 8.0% and have generally lower blood sugars and a lower average blood sugar than someone with an A1c of 7.0%! It is thought that these differences across individuals may be due to differences in how red blood cells bind glucose; however, there is still insufficient research to support variable glycation or deglycation rates.(7)
Estimates Do not Apply to All
Another issue with taking A1c to represent estimated glucose levels is that research suggests that these results may not apply to certain age groups and people of certain races/ethnicities. The DirecNet study, which examined A1c and blood glucose levels in children age 4 to 17 with type 1 diabetes, found significant variability in average glucose compared with A1c level, suggesting that using estimated average glucose values based on A1c could be problematic for this population.(5) There is also some research suggesting differences across racial/ethnic groups; however, results are inconclusive regarding whether race impacts glycation rate and A1c results.
Other Factors that may falsely impact HbA1c results
False increase:
- Anemias associated with decreased red blood cell turnover (iron deficiency anemia, vitamin B-12, folate deficiency anemias)
- Asplenia
- Uremia
- Severe hypertriglyceridemia
- severe Hyperbilirubinemia
- Chronic alcohol consumption
- Chronic salicylate ingestion
- Chronic opioid ingestion
- Lead poisoning
False Decrease:
- Anemia from acute or chronic blood loss
- chronic renal failure
- Sickle cell trait (6)
- Splenomegaly
- pregnancy
- Vitamin E ingestion
- Ribavitin and interferon0alpha
- Vitamin C ingestion (when A1c is measured by chromatography) due to competitive inhibition of glycosylation
It Misses Variability
Another important factor to mention is that A1c doesn’t take any variability into account. A person could be having severe low blood glucose events and extremely high blood glucose and have the same A1c as another person who had was relatively stable and in the normal range 90% of the time. Hypoglycemia can be extremely dangerous, but looking solely at A1c doesn’t provide any information on whether a patient is experiencing a lot of low blood sugars.
It Should be about the Individual not a Single Lab Value
Diabetes care is changing, and we now have the technology to better track and manage blood sugars. Yay!!! Although there is substantial research to support the A1c goals laid out by the American Diabetes Association and the American Association of Clinical Endocrinologists (<7 % and <6.5% respectively), I believe it is important to understand the limitations of treating diabetes based solely on the A1c test. This summer I’m working in a diabetes clinic in rural North Carolina. I understand that continuous glucose monitoring is not an affordable option for many, and that HbA1c is a efficient and useful for tracking patients with both type 1 and type 2 diabetes, but by continuing to judge ourselves and being treated based on HbA1c values alone, we are often missing those crucial details and patterns, which can greatly impact both our health and our quality of life.
For more information check out:
- Radin MS. Pitfalls in Hemoglobin A1c Measurement: When Results may be Misleading. Journal of General Internal Medicine. 2014;29(2):388-394. doi:10.1007/s11606-013-2595-x.
- Translating the hemoglobin A1c assay into estimated average glucose values(link is external)
David M. Nathan, Judith Kuenen, Rikke Borg, Hui Zheng, David Schoenfeld, and Robert J. Heine, for the A1c-Derived Average Glucose (ADAG) Study Group. Diabetes Care 2008 - Bunn HF, Haney DN, Kamin S, Gabbay KH, Gallop PM. The biosynthesis of hemoglobin A1c: slow glycosylation of hemoglobin in vitro. J Clin Invest. 1976;57:1652–1659. doi: 10.1172/JCI108436.
- Tahara Y, Shima K. Kinetics of HbA1c, glycated albumin, and fructosamine and analysis of their weight functions against preceding plasma glucose level. Diabetes Care. 1995;18:440–447. doi: 10.2337/diacare.18.4.440.
- The Diabetes Research in Children Network (DirecNet) Study Group. The relationship of A1c to glucose concentrations in children with type 1 diabetes: Assessments by high frequency glucose determinations by sensors. Diabetes care. 2008;31(3):381-385. doi:10.2337/dc07-1835.
- Lacy ME, Wellenius GA, Sumner AE, et al. Association of Sickle Cell Trait With Hemoglobin A1c in African Americans. JAMA. 2017;317(5):507–515. doi:10.1001/jama.2016.21035
- Welsh KJ, Kirkman MS, Sacks DB. Role of Glycated Proteins in the Diagnosis and Management of Diabetes: Research Gaps and Future Directions. Diabetes Care. 2016;39(8):1299-1306. doi:10.2337/dc15-2727.
- Wright LA-C, Hirsch IB. Metrics Beyond Hemoglobin A1C in Diabetes Management: Time in Range, Hypoglycemia, and Other Parameters. Diabetes Technology & Therapeutics. 2017;19(Suppl 2):S-16-S-26. doi:10.1089/dia.2017.0029.
